Claude Code Context Window: How It Works and How to Not Waste It
 By Neo Zino - builder of ClockedCode11 min read
Claude Code's context window spends less at startup than most guides claim and more on file reads and loaded MCP tools than they admit. Real, measured numbers.
Made with DispatchSEO
On this page
Claude Code's context window is 200,000 tokens by default (1 million on eligible plans with Fable 5, Sonnet 5, Opus 4.6+, or Sonnet 4.6), and less of it goes to fixed overhead than most writing on this topic claims. Anthropic's own representative figures put the system prompt, both CLAUDE.md tiers, auto memory, skill descriptions, and MCP tool names together at roughly 7,850 tokens, under 4% of the window, before you type a single word. What actually drains a session is everything after that: files Claude reads, tool output it keeps, and any MCP server that skips the on-demand loading Claude Code now uses by default.
TL;DR: Startup overhead is small and mostly fixed (~7,850 tokens, ~4% of 200k). File reads, tool output, and conversation history do the real damage as a session runs. MCP tool schemas defer by default and load only when Claude actually reaches for one - measured live for this article at roughly 213 tokens per tool. Auto-compact clears old tool output first, then summarizes if that's not enough, and several instruction sources (path-scoped rules, nested CLAUDE.md, most of a skill) don't fully survive it. Run
/contextto see your own breakdown instead of trusting anyone's estimate, including this one.
| Command | What it does |
|---|---|
/context | Live token breakdown by category, with optimization suggestions |
/mcp | Per-server MCP tool cost and connection status |
/memory | Opens the CLAUDE.md and auto-memory files currently loaded |
/compact | Summarizes the conversation now; add a focus like /compact focus on the auth bug to control what survives |
/clear | Wipes the session for genuinely unrelated work |
What actually fills the Claude Code context window before you type anything
A session isn't starting from zero the moment you run claude. Anthropic's own interactive walkthrough of the context window gives representative figures for everything that loads before your first prompt: the system prompt, your project's CLAUDE.md, auto memory (the first 200 lines or 25KB of MEMORY.md, whichever comes first), one-line skill descriptions, your global ~/.claude/CLAUDE.md, basic environment info, and the names of every connected MCP server's tools.
What loads before you type anything
Anthropic's own figures, 200k window
~7,850 tokens (~3.9% of a 200k window) spoken for before your first message. The rest of the bar is working room.
- System prompt4,200 tok
- Project CLAUDE.md1,800 tok
- Auto memory (MEMORY.md)680 tok
- Skill descriptions450 tok
- Global ~/.claude/CLAUDE.md320 tok
- Environment info280 tok
- MCP tool names (deferred)120 tok
Illustrative figures from Anthropic's interactive context-window walkthrough, not a fixed cost - your CLAUDE.md size, installed skills, and connected MCP servers move every one of these numbers. Run /context in a session to see yours.
Add those up and startup costs about 7,850 tokens, under 4% of a 200k window. That's a fraction of the "15,000 to 30,000 tokens gone before you type a word" figure still circulating in older writeups on this exact query. The gap is the MCP line: those older posts assume every connected server's full tool schemas load upfront, which used to be true and no longer is by default. What still moves that number a lot in practice is your own project's CLAUDE.md (representative figure: 1,800 tokens, but yours could be a fraction of that or several times larger) and how many skills you have installed. Keep CLAUDE.md under roughly 200 lines and move reference material into a skill or a path-scoped rule that only loads when it's relevant.
Does Claude Code load every MCP tool definition into context?
Not by default, and this is the fact most existing guides on this keyword get wrong or simply predate. Tool search is on by default: Claude Code lists only tool names and server instructions at session start, then searches for and loads a specific tool's full schema only when a task actually needs it. Connecting a server with 50 tools costs you a name in that list, not 50 full schemas.
You can override the default with the ENABLE_TOOL_SEARCH environment variable:
| Value | Behavior |
|---|---|
| (unset, default) | All MCP tools deferred, loaded on demand via search |
auto | Threshold mode: tools load upfront if they fit within 10% of the window, deferred otherwise |
auto:N | Same, with a custom percentage (auto:5 for 5%) |
false | Every tool loads upfront, no deferral - the old behavior |
A server can opt individual tools out of deferral with "anthropic/alwaysLoad": true, useful for the handful of tools you genuinely need on every single turn. Tool search itself requires a model that supports it (Sonnet 4.5, Haiku 4.5, Opus 4.5, and later), and Claude Code truncates tool descriptions and server instructions at 2KB each regardless of the setting.
To see what deferral is actually worth, I measured it live for this article instead of estimating. This build run has three MCP servers connected exposing 125 tools between them. I pulled the real JSON schema for 14 of those tools as Claude Code fetched them and measured the raw text.
Real tool-schema sizes, measured this run
14 tools, 2 live MCP servers
get_pages
~120 tok
get_conventions
~127 tok
get_trend_topics
~138 tok
get_ai_visibility
~133 tok
get_content_prefs
~132 tok
expand_trend_topic
~148 tok
build_suggestion_now
~145 tok
get_project
~200 tok
get_suggestions
~175 tok
get_cron_health
~215 tok
get_pipeline_pack
~172 tok
get_instructions
~310 tok
update_suggestion
~328 tok
serp_organic_live_advanced
~420 tok
Measured average
~213 tok / tool
This session's tool count
125 tools / 3 servers
Deferred (the default): about 120 tok for all 125tool names combined. Loaded eagerly at this sample's own measured average: an estimated ~26,625 tok (~13% of a 200k window) before this run typed a word. An estimate built from real measurements, not a guess.
That 213-token average is a small, mixed sample, not a universal constant, and I'm labeling it exactly that. But the shape holds regardless of the exact number: deferred, 125 tool names cost roughly what one loaded schema costs eagerly. That's the entire argument for tool search in one comparison, measured rather than asserted.
What happens when Claude Code auto-compacts
Claude Code compacts automatically as you approach the limit, and the process has two stages most explanations flatten into one. It clears older tool outputs first. Only if that isn't enough does it summarize the conversation itself, keeping your requests, key technical concepts, and important code snippets while dropping full tool output and intermediate reasoning. A completely full window doesn't end your session, but instructions from early in a long conversation can still get lost in the process, which is why persistent rules belong in CLAUDE.md rather than something you said forty messages ago.
What actually survives varies by mechanism, not uniformly:
What survives /compact
code.claude.com docsSystem prompt & output style
Unchanged - never part of message history
Project CLAUDE.md & unscoped rules
Reinjected from disk
Auto memory (MEMORY.md)
Reinjected from disk
Path-scoped rules (paths: frontmatter)
Lost until a matching file is read again
Nested CLAUDE.md in subdirectories
Lost until a file in that folder is read again
Invoked skill bodies
Reinjected, capped at 5k tok/skill and 25k tok total
Hooks
Not applicable - they run as code, not context
Skill descriptions (the one-line index Claude sees at startup) are the exception that proves the rule: they do not reload after /compact at all, only skills you actually invoked survive.
Two details worth knowing before you rely on either side of that table. First, you can steer what a manual compact keeps: add a "Compact Instructions" section to CLAUDE.md, or run /compact focus on the API changes before starting a long new task, rather than letting the automatic pass guess. Second, if a single file or tool output is large enough that context refills immediately after each summary, Claude Code stops auto-compacting after a few attempts and shows a thrashing error instead of looping forever - a real failure mode, not a hypothetical one, and worth knowing the name of if you ever hit it.
How do I check my own context usage?
Three built-in commands answer this without any setup. /context gives a live, categorized breakdown of what's using space right now, plus suggestions for trimming it. /mcp breaks costs down per connected server, which is where you'll spot the one bloated connection dragging the rest up. /memory opens the CLAUDE.md and auto-memory files currently loaded, so you can see and edit what's actually in context instead of guessing at what's in the file on disk. Run all three in a fresh session first to see your real fixed overhead, the same way the numbers in this article came from Anthropic's own docs and this build's own measurements, not a guess.
When should I clear, compact, or start over?
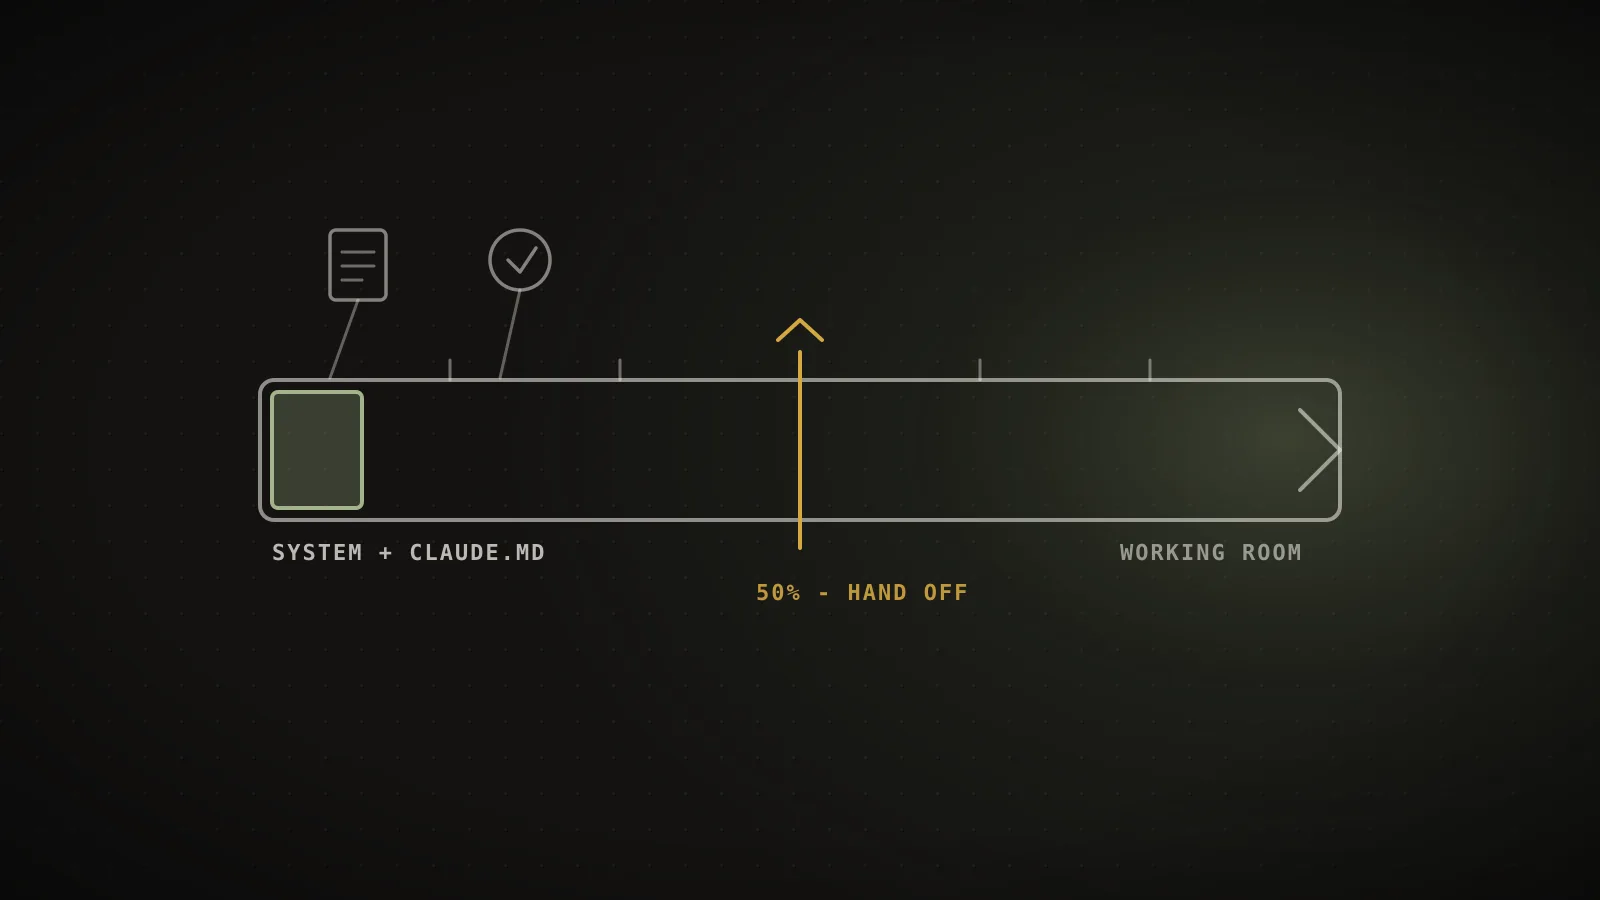
These aren't three names for the same action. /clear is for genuinely unrelated work: it wipes the slate so a finished task's context stops crowding out the next one. /compact (ideally with a focus) is for staying inside the same task once context is getting heavy, trading full detail for a structured summary that keeps working. A fresh session is the third option, and it's the one ClockedCode's 50% context rule is built around: once a session crosses roughly half its window, save a handoff file, start clean, and resume - because even a well-targeted compact still loses full file contents and intermediate reasoning that a truly fresh read-back wouldn't need to reconstruct at all.
Two habits compound with this one. Delegate large, independent research to a subagent: it gets its own separate context window, so file reads it performs never touch yours, and only its final summary comes back. And audit your MCP servers the way the guide to keeping MCP servers from eating your context walks through, since tool search only defers what a server exposes - a server you never use still costs a name in the startup list and real tokens the moment anything calls one of its tools. If token waste is a recurring problem rather than a one-off, the wider usage-limit checklist covers the other seven habits that add to it, from model choice to parallel sessions sharing one account limit.
Does a bigger context window fix this?
Fable 5, Sonnet 5, Opus 4.6 and later, and Sonnet 4.6 support a 1 million token window on eligible plans, five times the default. It's a real fix for one specific problem: a session that needs to hold a genuinely large amount of relevant material at once, like a sprawling monorepo refactor. It is not a fix for waste. A 600-line CLAUDE.md or an eagerly-loaded MCP server still taxes every turn at the larger size, the bill just arrives later. And a 1M window that does fill up compacts through the same process as a 200k one, so the habits in this article don't become optional, they just buy more room before they matter.
FAQ
What is the Claude Code context window and how big is it?
It's Claude's working memory for the session: your conversation, CLAUDE.md, auto memory, loaded skills, MCP tool schemas, and every file it has read, all re-sent on every turn. The default is 200,000 tokens. Fable 5, Sonnet 5, Opus 4.6 and later, and Sonnet 4.6 support a 1 million token window on eligible plans.
What actually fills up Claude Code's context window?
Before you type anything: the system prompt (about 4,200 tokens in Anthropic's own figures), your project CLAUDE.md, auto memory, skill descriptions, your global CLAUDE.md, environment info, and MCP tool names, together under 4% of a 200k window. After that, file reads, tool output, and conversation history do almost all the damage - a single large log file or a chatty MCP response can cost more than everything at startup combined.
Does Claude Code load every MCP tool definition into context?
No, not by default. As of the current docs, MCP tool schemas are deferred and loaded on demand via tool search - only tool names and server instructions load at session start. Set ENABLE_TOOL_SEARCH=auto to load schemas upfront when they fit within 10% of the window, or ENABLE_TOOL_SEARCH=false to load everything, matching how MCP used to work.
What happens when Claude Code auto-compacts?
It clears older tool outputs first, then summarizes the conversation if that alone doesn't free enough space. The system prompt and output style are untouched, project CLAUDE.md and auto memory reload from disk, invoked skill bodies reload capped at 5,000 tokens per skill and 25,000 total, and path-scoped rules or nested CLAUDE.md files stay gone until Claude reads a matching file again.
How do I check my own context usage in Claude Code?
Run /context for a live breakdown by category with optimization suggestions, /mcp to see per-server tool costs, and /memory to open the CLAUDE.md and auto-memory files currently loaded. All three work inside any session, no flags needed.
Should I use /compact, /clear, or start a fresh session?
/compact focus on X keeps what you choose instead of what auto-compact guesses is important, and is worth running before a long new task rather than waiting for it to trigger on its own. /clear wipes the slate for genuinely unrelated work. A fresh session (the 50% rule) beats both when the task is the same but the conversation has gotten long and noisy, since compaction still loses full file contents and intermediate reasoning even when it keeps the gist.
Does the 1M token context window fix Claude Code's context problems?
It raises the ceiling, not the discipline. A bloated CLAUDE.md or an eagerly-loaded MCP server still taxes every single turn at the larger size, just with more room before you notice. It's plan- and model-gated, not universal, and a still-full 1M window compacts the same way a 200k one does.